
Presentation entitled “Helping Faculty Develop Online Courses”
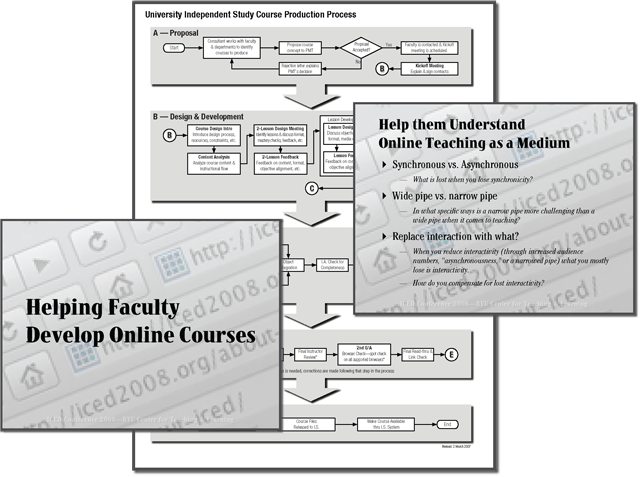
Powerpoint slides and flowchart from the presentation.
Description: In 2008 I gave a presentation at the annual conference of the International Consortium for Educational Development (ICED) held in Salt Lake City. The title of my presentation was “Helping Faculty Develop Online Courses.” The presentation included PowerPoint slides and a handout which included graphics of development flowcharts and timelines. Presentation was attended by over 30 international participants and was very well received.
My Roles/Contributions: Developed the concept, developed and produced the Powerpoint slides (instructional and graphic design) and produced a handout which included a flowchart and timeline for eLearning development, which I had also developed. I also gave the presentation.
Instructional Details: Presentation was basically used to give advice based on experience in working with faculty. However, it was organized with relevant and useful handouts which included an outline of the presentation, development flowchart and timeline graphics, and a copy of the table of contents from CID’s course development guide. The outline was both what I followed while giving it, and a guide so that participants could pay attention to the presentation without needing to take copious notes.
Graphic Details: I organized (parsed) and developed the Powerpoint slides including creating a unique background, and selecting fonts that would be fun and yet informative.
The flowchart and timeline had been developed separately and incorporated into this presentation.
The flowchart takes a very complex process and groups it into five basic clusters to simplify understanding of the flow. The graphic uses shaded rectangles with arrows to show this larger flow, with the individual flowchart components inside each.
The timeline is a visual representation of the various stages noted in the flowchart, with the vertical height proportionally representing the amount of time in weeks of each.
Download (1) the outline of the presentation (.pdf; 62K), (2) a document showing a few of the PowerPoint slides (.pdf; 264K), or (3) a copy of the flowchart and timeline handout (.pdf; 125k).
